Using finish times to map a marathon
Stage 1: grab the data
Stage 2: process the data
Stage 3: present the data
Stage 4: possible improvements
Stage 1: grab the data
I recently ran a half marathon, and wanted to use the results from the three events (10/21/42km) to map out each competitors journey through the course. Kind of a traffic map, but for humans.
The official results website had finish times, grouped by x amount of athletes per page. Split times were available but each athlete had their own page. And the data was just served up as HTML so would be cumbersome to capture. There was also an app for the event, which had a different data source, with the data being in JSON. Again, splits were only per athlete, but the advantage was the data format.
I reused an existing ruby script that made use of the Typhoeus library to send a whole bunch of requests to the server to grab the data, and store it all in a JSON file. I could now process this offline.
I also need the GPX files for the event so I could use the times to plot where on the map an athlete would be. A quick look at Strava and these were easy to find.
Stage 2: process the data
For the sake of familiarity, I chose to use PHP from the command line rather than say python or perl, but I’ve been using PHP a little more recently. PHP can readily import the JSON timing data, and also the GPX files. Afterall, the GPX files are just XML files with a specific purpose.
I was then able to scale each GPX file to be the correct course length, as there is always a slight variance in official distance and the recorded GPS distance. Each timing record for an athlete was then mapped to the GPS record, and then remapped back to a timing record at a defined interval depending on the desired detail.
So at this point, each athlete now has a recorded position along the route for every 60 seconds of their race.
Then, for every athlete, I merged all the timing data into one big list, where each time interval has a group of coordinates. I also included the race event that the coordinate belonged to so that when presented it would be clear which race each marker on the map belonged to.
  08:45:00
    lat -39.123, lon 176.456, category 10km
    lat -39.777, lon 176.777, category 10km
    lat -39.951, lon 176.951, category 42km
  08:50:00
    lat -39.234, lon 176.567, category 10km
    lat -39.888, lon 176.888, category 10km
    lat -39.955, lon 176.955, category 42km
I could have extended this further by including bib numbers or current positions within the final data, but opted not too as this is just an experiment/proof of concept.
Stage 3: present the data
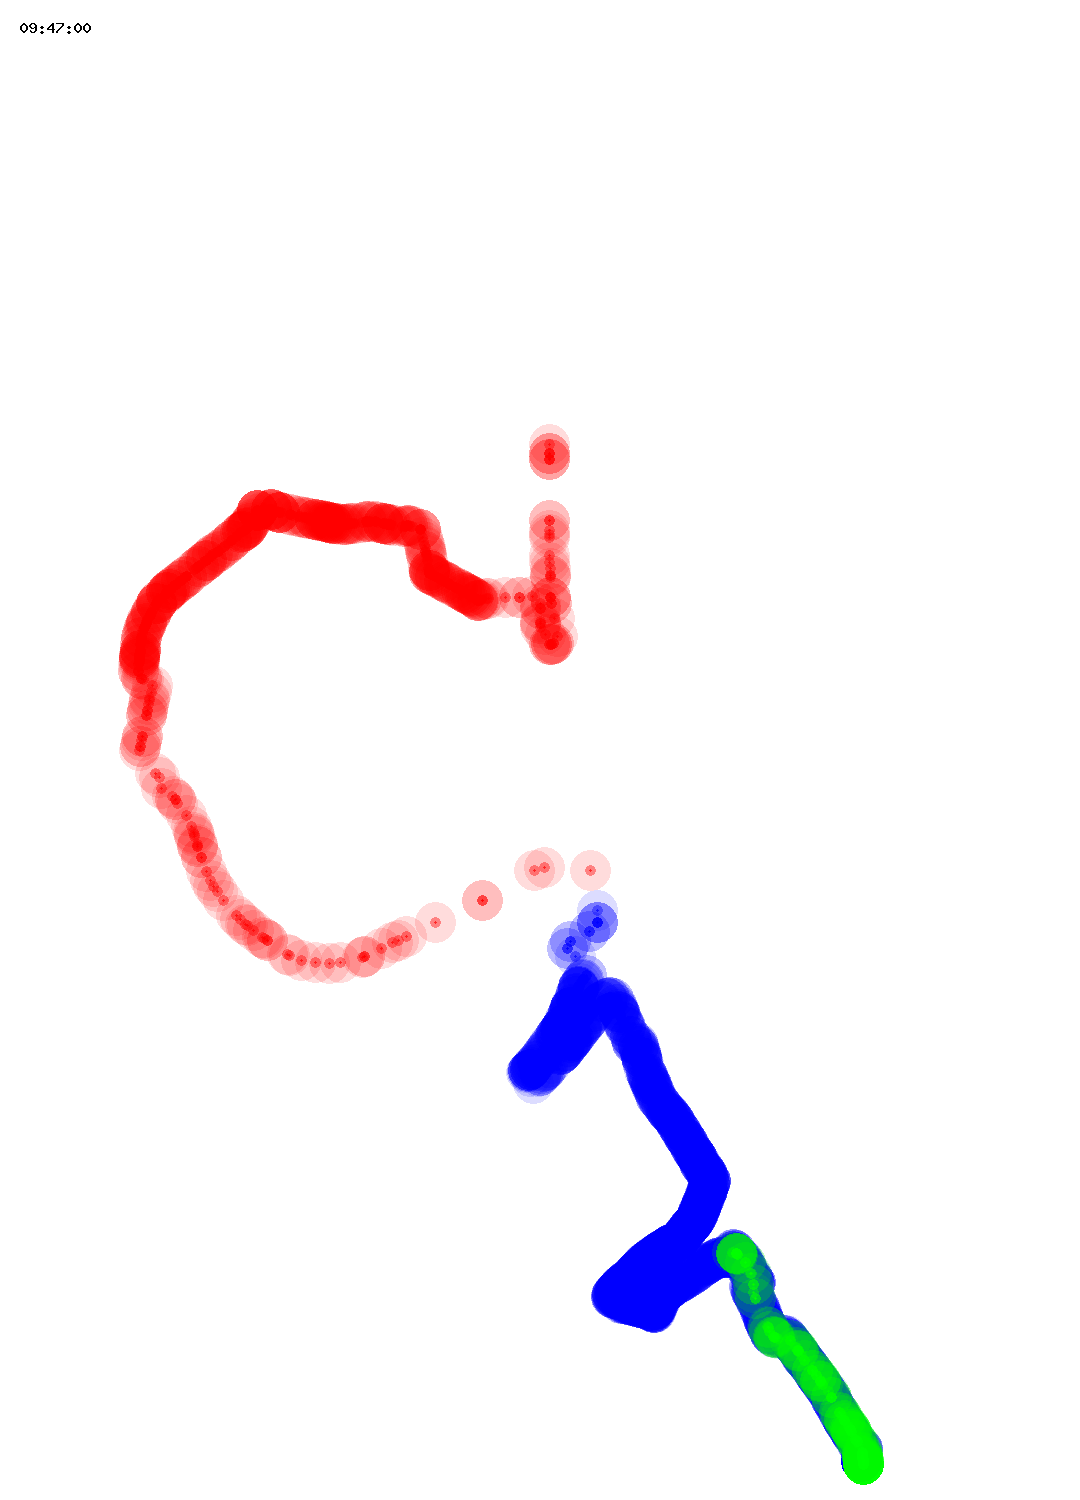
Now that a list of times had GPS coordinates grouped with them, I converted the coordinates to x,y plots in order to create a still image such as this one. Each timestamp got an image, and with each image stored I could then merge them using ffmpeg into a little video file.
The video above has green dots for the 10km, blue for the 21km and red for 42km athletes. As the race progresses you can see how the human traffic snakes along the course.
Stage 4: possible improvements
Being a proof of concept, I’ve left it unpolished. I could add a number of features, but, there’s no need to as it was just an exercise for myself.
Possible areas to work on include:
- overlaying the plotted points onto a street map in order to add some context
- showing the courses on the map so even once the athletes have gone along the course, the course is still visible
- improving how I calculate x,y coordinates in relation to map size
- ignoring PHP’s XML parsing functions and just process the files in as text (the xml parsing is actually quite slow)
- properly reducing the number of data points in each GPX file as a 42km GPX file could have 8000+ data points which are mostly redundant
- improving overall run time, not too much of an issue for a one off, but the data collection can take a minute, and so can the processing
- the image output from PHP currently is in PNG format, but SVG would probably be more suited to the vector based graphics in the output
- if the output is going to be a webpage, an interactive javascript based map could look very nice
- tidy up the code
- and so on…